Advertisement
At the heart of data science, the ability to measure how similar or different two things are can change everything. Whether it's finding duplicate files, spotting fraud, or building a recommendation system, understanding these measures lets you make smarter decisions. They form the base of many models and algorithms, even if we don’t always think about them. So, let’s break it down and see why they matter so much.
Let's get the basics straight first. Similarity measures inform us to what extent two objects are similar. The more the score is, the more similar they are. Dissimilarity measures work in a reversed manner. They indicate how much different the two objects are. The higher the score, the more they differ. Pretty simple, right?
But in practice, it gets a little more interesting. Think of comparing two movies for a recommendation system. We can't just say they are the same because they are both comedies. We need numbers to back up that claim. These numbers come from similarity and dissimilarity measures, calculated based on the features the objects have.
Once you start spotting them, you’ll realize they’re almost everywhere.
Recommendation Systems: Finding movies, songs, or products that match a user's past choices.
Clustering: Grouping customers based on their shopping habits.
Fraud Detection: Spotting patterns that are out of place.
Image Recognition: Matching new images to known categories based on features.
Text Mining: Comparing articles, emails, or social media posts for similarity.
Each case relies on picking the right measure and making sure it reflects the relationships that actually matter for the problem you’re solving.
Now that you know what they are, let's walk through a few popular ways to calculate similarity:
Cosine similarity looks at the angle between two vectors. Instead of focusing on their distance, it cares about their direction. If the angle is small, they are similar. If it’s wide, they are not.
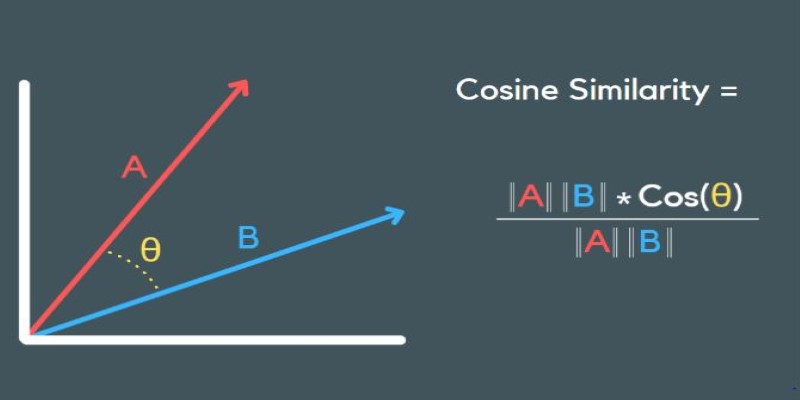
This method shines when you’re working with text data, like comparing two documents or user reviews. Words get converted into numbers (vectors), and cosine similarity checks how close these vectors are.
Jaccard is all about sets. It measures how many elements two sets share divided by the total number of unique elements between them.
For example, if two users like many of the same movies but differ on a few, Jaccard similarity gives you a quick, clear number showing how much their tastes overlap.
Pearson correlation checks how two variables move together. If both go up at the same time, you get a positive score. If one goes up while the other goes down, it’s negative.
The dice coefficient is similar to that of Jaccard but gives more weight to matches. It's calculated by taking twice the number of common elements divided by the total number of elements in both sets.
Soft cosine goes a step beyond regular cosine similarity. It not only checks if two documents are similar but also whether the words in them are similar. For instance, it considers "dog" and "puppy" closer than "dog" and "car."
This measure is super helpful when you’re comparing continuous data like sales numbers, temperatures, or any situation where the pattern matters more than the exact values.
While similarity focuses on closeness, dissimilarity talks about the gap. And sometimes, it’s the gap that holds the answers.
This one’s like using a ruler between two points. The shorter the distance, the more similar they are. The farther apart, the more different. Euclidean distance is one of the first tools data scientists reach for when clustering or grouping data points, especially when features are all measured on similar scales.
Imagine you can only move up, down, left, or right — no diagonal moves. That’s Manhattan distance. It adds up the absolute differences between features instead of calculating the straight line. It’s a neat trick when dealing with grids, like city maps or chessboards, where diagonal travel doesn’t exist.
Hamming distance counts how many positions two strings differ at. So if two binary codes are not exactly the same, Hamming distance tells you how many bits you would have to flip to make them identical. It’s often used in error detection systems or places where precision down to a single character matters.
Minkowski distance is like a general formula that can become Euclidean or Manhattan distance depending on the value of a parameter called “p.” When p=2, it’s Euclidean. When p=1, it’s Manhattan. If you need flexibility depending on your data shape and problem type, Minkowski gives you room to adjust.
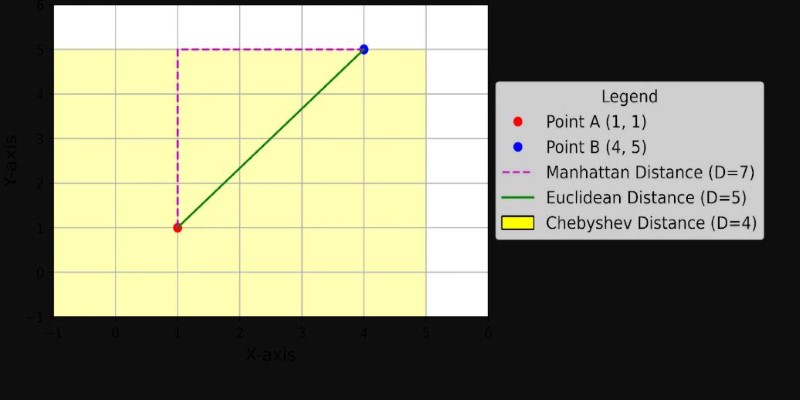
Chebyshev distance measures the greatest single difference along any coordinate dimension. Think about the maximum effort needed along one axis to get from one point to another. It’s especially useful in certain kinds of games, manufacturing systems, or grid-based problems where only the largest step matters.
Choosing the Right Measure for Your Problem
Not every situation needs the same tool. The trick is knowing what kind of data you have and what story you want the measures to tell.
Scaling your data matters, too. If your features are on wildly different scales (think age vs income), distance measures like Euclidean can mislead you. A simple fix is to normalize or standardize the data before running your calculations.
Measuring how similar or different things are sounds basic, but it runs deep in data science. The measures you pick set the stage for everything that comes after — from building better models to making smarter decisions. Whether you're using cosine similarity to match news articles or Euclidean distance to group sales data, these tools are your bridge to understanding patterns that aren't obvious at first glance.
Advertisement

Apple unveiled major AI features at WWDC 24, from smarter Siri and Apple Intelligence to Genmoji and ChatGPT integration. Here's every AI update coming to your Apple devices

Looking for a better way to code, research, and write in Jupyter? Find out how JupyterAI turns notebooks into powerful, intuitive workspaces you’ll actually enjoy using

Looking for smarter AI that understands both text and images together? Discover how Meta’s Chameleon model could reshape the future of multimodal technology

Wondering why your data feels slow and unreliable? Learn how to design ETL processes that keep your business running faster, smoother, and smarter
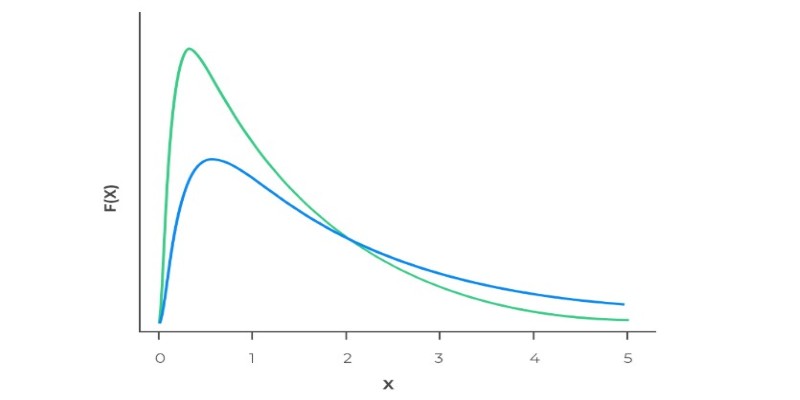
Ever wonder why real-world data often has long tails? Learn how the log-normal distribution helps explain growth, income differences, stock prices, and more

Working with rankings or ratings? Learn how ordinal data captures meaningful order without needing exact measurements, and why it matters in real decisions

Confused about machine learning and neural networks? Learn the real difference in simple words — and discover when to use each one for your projects

Learn what vector databases are, how they store complex data, and why they're transforming AI, search, and recommendation systems. A clear and beginner-friendly guide to the future of data storage
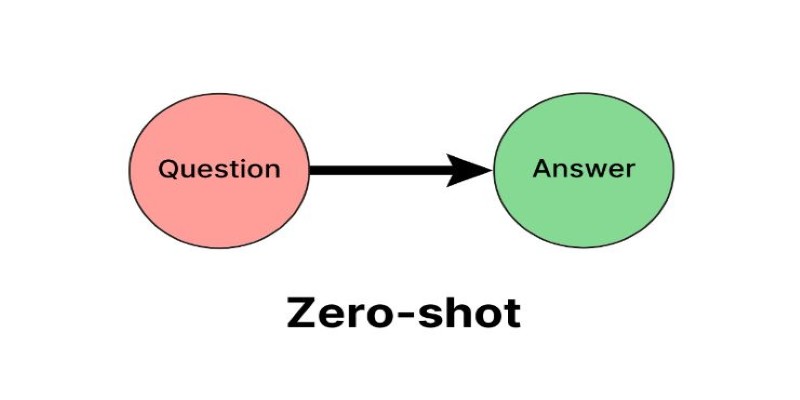
Learn what Zero Shot Prompting is, how it works, where it shines, and how you can get the best results with simple instructions for AI

Think of DDL commands as the blueprint behind every smart database. Learn how to use CREATE, ALTER, DROP, and more to design, adjust, and manage your SQL world with confidence and ease

Learn how to build an AI app that interacts with massive SQL databases. Discover essential steps, from picking tools to training the AI, to improve your app's speed and accuracy

Looking for a laptop that works smarter, not harder? See how Copilot+ PCs combine AI and powerful hardware to make daily tasks faster, easier, and less stressful