Advertisement
When you hear about probability distributions, chances are your mind quickly jumps to the normal distribution. And for good reason — it’s everywhere. But there’s another one that’s just as interesting and just as useful in real-world scenarios: the log-normal distribution. Unlike the normal curve, which is beautifully symmetric, the log-normal distribution stretches its tail far out to the right. And it’s exactly this stretched tail that makes it so handy when dealing with real-world quantities like income, stock prices, and even the size of particles in the air. Let's break it down in the clearest way possible.
The log-normal distribution is what you get when the logarithm of a variable follows a normal distribution. In simple words, if you take a bunch of numbers, log them (using natural log or base-10 log), and those log-transformed numbers form a normal curve, then the original numbers are said to follow a log-normal distribution.
Here’s an easy way to think about it: imagine growth processes that multiply over time, like how money grows in a savings account or how bacteria multiply. These kinds of things rarely spread out evenly — instead, you often get a bunch of small values and a few really large ones. That’s exactly the kind of shape a log-normal distribution has: a steep climb up to a peak, then a long, slow descent out into bigger numbers.
In a regular normal distribution, outcomes are centered around the mean, and the probabilities fall away symmetrically. In a log-normal world, most outcomes gather near the lower end, but a few rare events stretch the right side much farther out.

It’s not just a neat mathematical idea — the log-normal distribution shows up because of how natural growth and multiplication behave over time. When things grow in percentages instead of fixed amounts, or when lots of small random factors multiply together, the log-normal shape naturally pops out.
Take a look at these examples:
Personal income: Most people earn a moderate income, but there are a few outliers earning sky-high salaries. That long tail of high earners matches a log-normal pattern much better than a normal one.
Stock prices: Prices don’t move up or down by a fixed dollar amount every day; they move in percentages. This means today’s price depends on yesterday’s price, and tomorrow's price depends on today’s. Over time, these percentage changes stack up multiplicatively, leading to a log-normal shape.
Sizes of living organisms: Whether it’s tree heights or animal weights, you’ll often find that there are many small ones and only a few giants. Again, this is perfect territory for the log-normal distribution.
The common thread? Multiplication and growth.
Don't worry — you don’t need a PhD to understand the basic math here.
In the normal distribution, a variable XXX follows:
X∼N(μ,σ^2)
where μ\muμ is the mean and σ\sigmaσ is the standard deviation.
In a log-normal distribution, it’s the log of XXX that follows a normal curve:
ln(X)∼N(μ,σ^2)
This slight twist makes a big difference. Instead of being centered around a mean with symmetry on both sides, the distribution becomes skewed right. There's a sharp peak and then a long tail that just keeps going.
Here are some quick points that help visualize it:
Mean: The mean of a log-normal variable is larger than its median. So, if you're looking at average income, the average will be pulled up by the few super-rich folks.
Variance: There's a bigger spread in values. More variation, especially toward the higher end.
Shape: Always positively skewed — there’s never a left-side long tail.
And here's something fun: If you multiply a bunch of random positive numbers together, the result will almost always lean toward a log-normal distribution, no matter how the individual numbers were distributed to begin with. This is a bit like the Central Limit Theorem for products instead of sums.

Let’s get real-world for a second. Knowing about the log-normal distribution isn’t just useful for academic exercises — it’s something that shows up across tons of fields.
Finance When valuing options or modeling stock returns, analysts often use models assuming stock prices follow a log-normal distribution. It makes sense: stock prices can’t go negative, and they tend to experience compounding returns over time.
Environmental Science Pollutants, rainfall amounts, and natural resource distributions often show a log-normal pattern. Some areas have average pollution levels, but a few spots have extreme concentrations — and a log-normal model can better predict those rare but significant cases.
Medicine and Biology The sizes of cells, bacteria populations, and tumor growth rates tend to behave in a log-normal fashion. This is particularly helpful when modeling the progression of diseases or evaluating treatment effects that grow or shrink multiplicatively over time.
Engineering When dealing with the fatigue life of materials or the strength of products, engineers often assume log-normality. Failures don't occur evenly; they multiply over usage cycles, and some products last far longer than the average, creating that long tail.
You’re probably seeing the theme: anytime growth, accumulation, or multiplication plays a major role, the log-normal distribution becomes a natural fit.
The log-normal distribution might not get as much attention as the classic normal curve, but it's everywhere once you start looking. From stock markets to biology, it captures real-world behavior better than symmetrical models can. It reminds us that many natural and financial processes are shaped by growth, not balance. Recognizing when a log-normal model fits can help you make better predictions, smarter decisions, and deeper analyses. Whether you're studying income gaps, stock prices, or even the sizes of living things, the log-normal distribution gives you a powerful tool to understand the hidden patterns. So next time you spot a long right tail, you'll know exactly what's at play.
Advertisement

Get a clear overview of Google's seven Gemini AI models—each built with a unique purpose, from coding assistance to fast response systems and visual data understanding

Learn what Zero Shot Prompting is, how it works, where it shines, and how you can get the best results with simple instructions for AI

Ever wonder how data models spot patterns? Learn how similarity and dissimilarity measures help compare objects, group data, and drive smarter decisions

Learn how to build an AI app that interacts with massive SQL databases. Discover essential steps, from picking tools to training the AI, to improve your app's speed and accuracy

Learn what stored procedures are in SQL, why they matter, and how to create one with easy examples. Save time, boost security, and simplify database tasks with stored procedures

Curious about Llama 3 vs. GPT-4? This simple guide compares their features, performance, and real-life uses so you can see which chatbot fits you best

Understand the principles of Greedy Best-First Search (GBFS), see a clean Python implementation, and learn when this fast but risky algorithm is the right choice for your project

From training smarter AI to protecting privacy, synthetic data is fueling breakthroughs across industries. Find out what it is, why it matters, and where it's making the biggest impact right now

Learn what vector databases are, how they store complex data, and why they're transforming AI, search, and recommendation systems. A clear and beginner-friendly guide to the future of data storage

Looking for a laptop that works smarter, not harder? See how Copilot+ PCs combine AI and powerful hardware to make daily tasks faster, easier, and less stressful

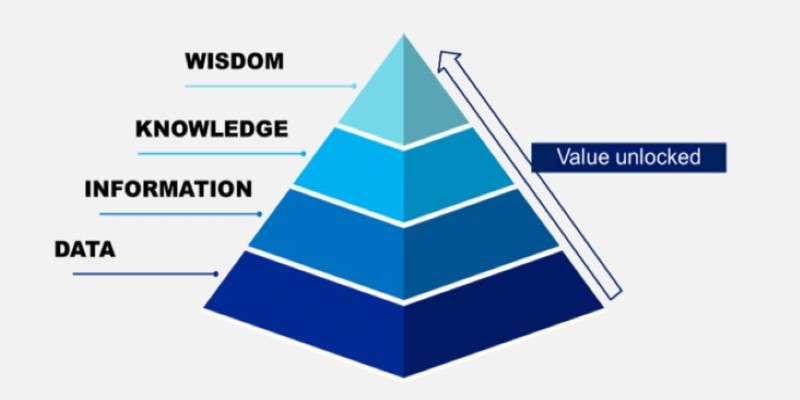
Ever wondered how facts turn into smart decisions? Learn how the DIKW Pyramid shows the journey from raw data to wisdom that shapes real choices

Explore the top 8 AI travel planning tools that help organize, suggest, and create customized trip itineraries, making travel preparation simple and stress-free