Advertisement
Understanding patterns in data can make all the difference when trying to predict outcomes or make better decisions. That’s where regression analysis steps in. At its heart, regression analysis is a way to explore how one or more variables are linked to an outcome. Think of it as a smart way to draw a line through your data points so you can see what they’re trying to tell you.
Whether you're determining whether years of experience affect pay or attempting to forecast house prices by size, regression analysis assists you in charting that relationship. But there's a bit more to it than simply plotting lines!
When you hear a person say regression analysis, they're typically discussing looking for correlations between a dependent variable and one or more independent variables. The dependent variable is the result that matters to you. The independent variables are the inputs you suspect are affecting that result.
For instance, when analyzing how study hours influence exam scores, the exam score is the dependent variable, and study hours are the independent variable. Regression analysis applies all those points and determines the line (or curve) that best fits the relationship.
The most straightforward form is linear regression, in which the relationship resembles a straight line. However, for a slightly more complex relationship, other forms, such as multiple regression or logistic regression, are used.

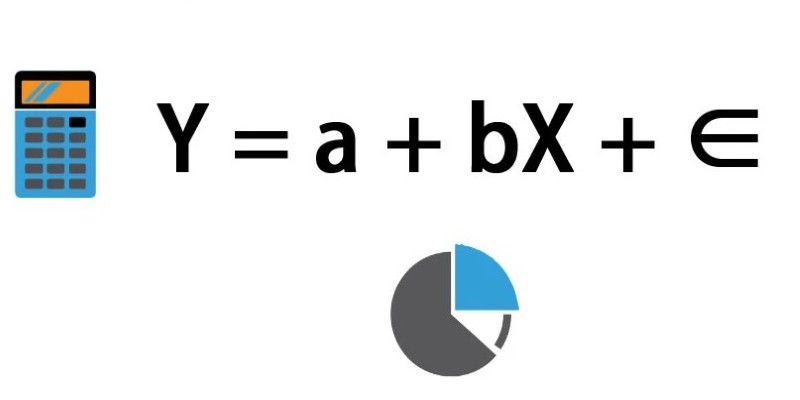
You don't need to be a mathematical genius to understand the general concept. The regression equation typically appears as follows:
Y = a + bX + e
Where:
The goal is to find the best values for a and b that make the line fit your data points as closely as possible.
Regression analysis isn’t one-size-fits-all. Different situations call for different types, and here are some of the most common ones:
This is the go-to when you have just one independent variable. It draws a straight line through your data to model the relationship. It’s simple, clean, and often surprisingly effective when the connection between variables is straightforward.
Sometimes, life is more complicated than a single cause. Multiple linear regression steps up when you have two or more independent variables. For instance, predicting house prices might depend on size, location, number of bedrooms, and more. This method lets you weigh all those factors at once.
When your dependent variable is something like "yes" or "no," logistic regression is the tool to use. It helps figure out the probability of a certain event happening, like whether a customer will buy a product or not.
Relationships aren't always straight lines. Sometimes, they curve! Polynomial regression fits your data with a curved line, which can capture more complex patterns that a straight line would miss.
Each type has its time and place. Choosing the right one depends on the nature of your data and what you’re trying to find out.

Regression analysis pops up almost everywhere, and with good reason. Here’s why it’s such a popular tool:
One of the biggest draws of regression analysis is its ability to forecast. Whether it's predicting next quarter’s sales or the risk of heart disease based on lifestyle factors, regression models can offer valuable insights.
Beyond just predictions, regression helps explain how variables are connected. Does marketing spending really drive revenue? Does exercise frequency affect weight loss? Regression models help put numbers to those relationships.
When you have loads of possible variables, regression can help pinpoint which ones really matter. For example, in a hiring process, it might reveal that years of experience and certain certifications are the strongest predictors of success, while other factors barely make a difference.
Good decisions often come from understanding your data, and regression analysis turns raw numbers into clear insights. Whether it’s setting a budget, crafting a marketing campaign, or adjusting production levels, regression models can back up your choices with evidence.
Regression analysis is a powerful tool, but it’s easy to trip up if you’re not careful. Here are a few common mistakes:
Just because two variables move together doesn’t mean one causes the other. Ice cream sales and swimming pool drownings might both go up in summer, but buying ice cream doesn’t cause drowning. Always be cautious about drawing cause-and-effect conclusions without further evidence.
A few extreme data points can throw off your whole regression model. It’s important to spot outliers and figure out whether they should be included, adjusted, or removed.
Adding too many variables can make your model overly complicated and fit your sample data too closely. It might perform perfectly on old data but terribly on new data. A good model should be simple enough to generalize to new situations.
Each type of regression has a specific job. Using simple linear regression when your data needs a polynomial approach (or vice versa) can lead to bad predictions. Always take a good look at your data and the shape of the relationship first.
Regression analysis is a straightforward yet deeply useful way to understand how things are connected and to predict outcomes. Whether you’re managing a business, conducting research, or just curious about patterns in the world, learning how to use regression analysis gives you a serious advantage.
The best part? Once you get the hang of it, you’ll start seeing connections and opportunities that were hiding in plain sight. Pretty amazing what a simple line through a scatter of dots can reveal!
Advertisement

Working with rankings or ratings? Learn how ordinal data captures meaningful order without needing exact measurements, and why it matters in real decisions

Learn what stored procedures are in SQL, why they matter, and how to create one with easy examples. Save time, boost security, and simplify database tasks with stored procedures

Wondering how numbers can explain real-world trends? See how regression analysis connects variables, predicts outcomes, and makes sense of complex data

Confused about whether to fine-tune your model or use Retrieval-Augmented Generation (RAG)? Learn how both methods work and which one suits your needs best

Looking for a better way to code, research, and write in Jupyter? Find out how JupyterAI turns notebooks into powerful, intuitive workspaces you’ll actually enjoy using

Apple unveiled major AI features at WWDC 24, from smarter Siri and Apple Intelligence to Genmoji and ChatGPT integration. Here's every AI update coming to your Apple devices

Confused about machine learning and neural networks? Learn the real difference in simple words — and discover when to use each one for your projects

Learn what vector databases are, how they store complex data, and why they're transforming AI, search, and recommendation systems. A clear and beginner-friendly guide to the future of data storage

The Dead Internet Theory claims much of the internet is now run by bots, not people. Find out what this theory says, how it works, and why it matters in today’s online world

Curious about Llama 3 vs. GPT-4? This simple guide compares their features, performance, and real-life uses so you can see which chatbot fits you best

Wondering how everything from friendships to cities are connected? Learn how network analysis reveals hidden patterns and makes complex systems easier to understand

Wondering why your data feels slow and unreliable? Learn how to design ETL processes that keep your business running faster, smoother, and smarter